---
comments: true
description: Learn how to visualize YOLO inference results directly in a VSCode terminal using sixel on Linux and MacOS.
keywords: YOLO, inference results, VSCode terminal, sixel, display images, Linux, MacOS
---
# Viewing Inference Results in a Terminal

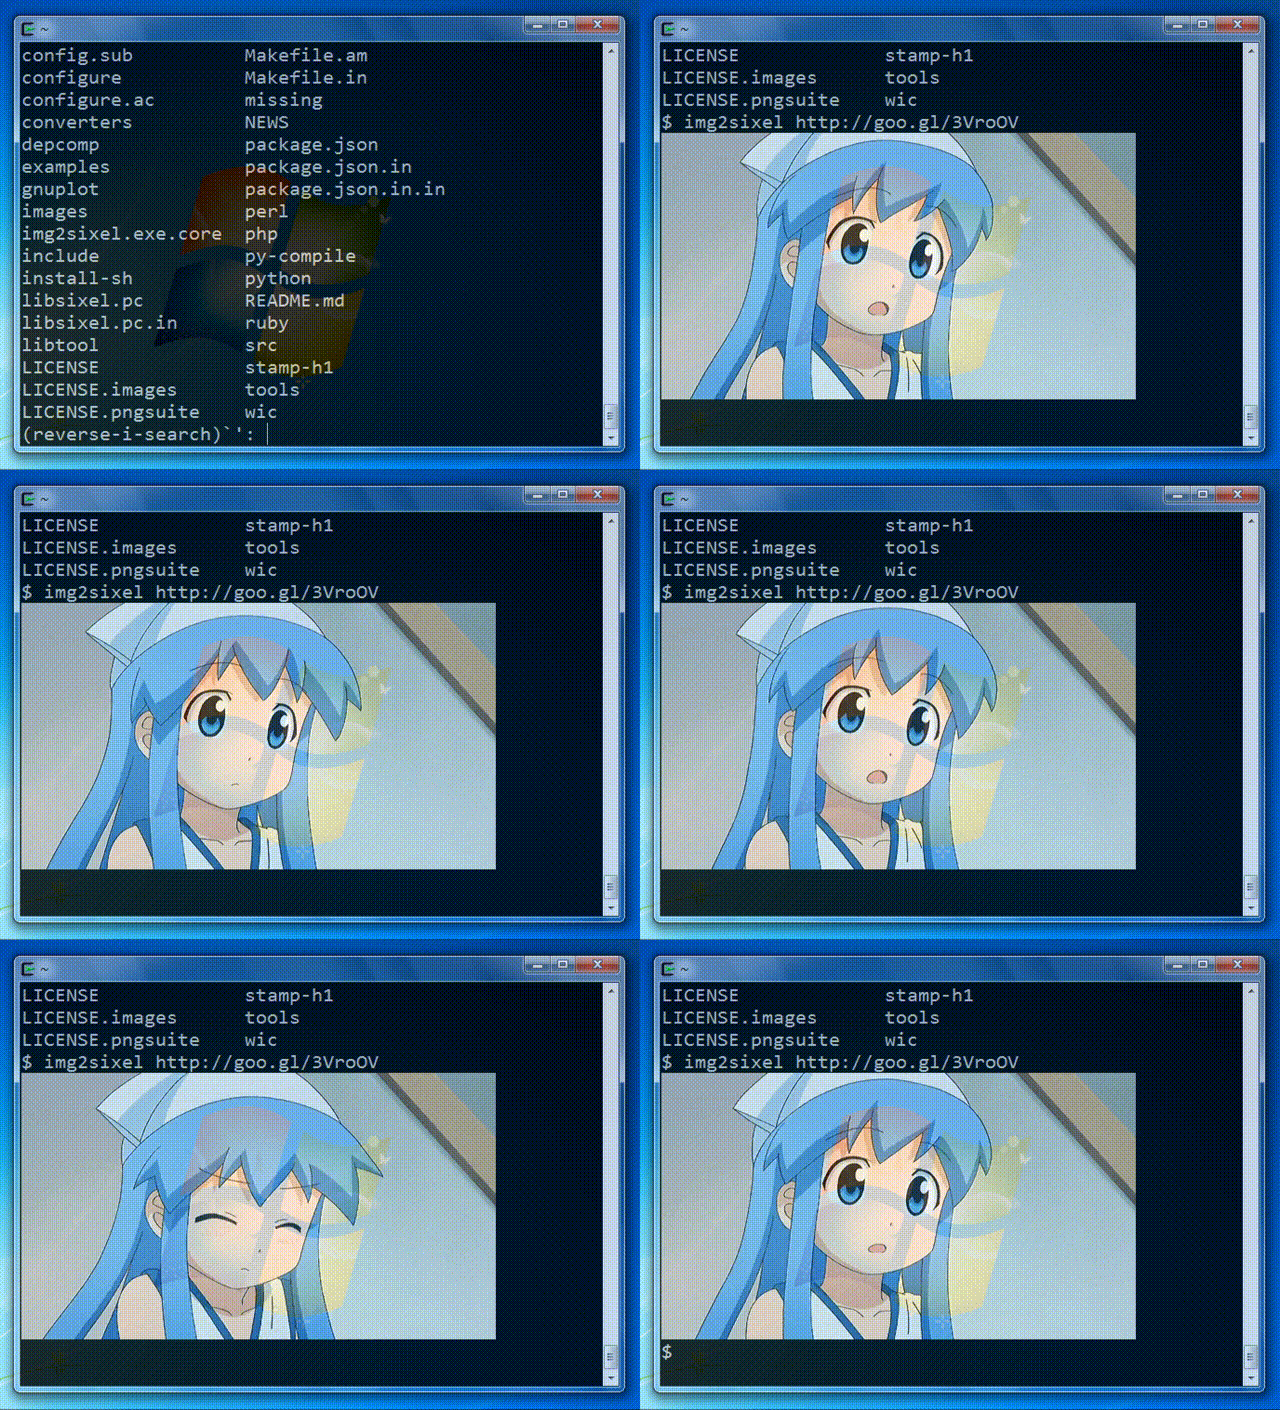
Image from the [libsixel](https://saitoha.github.io/libsixel/) website.
## Motivation
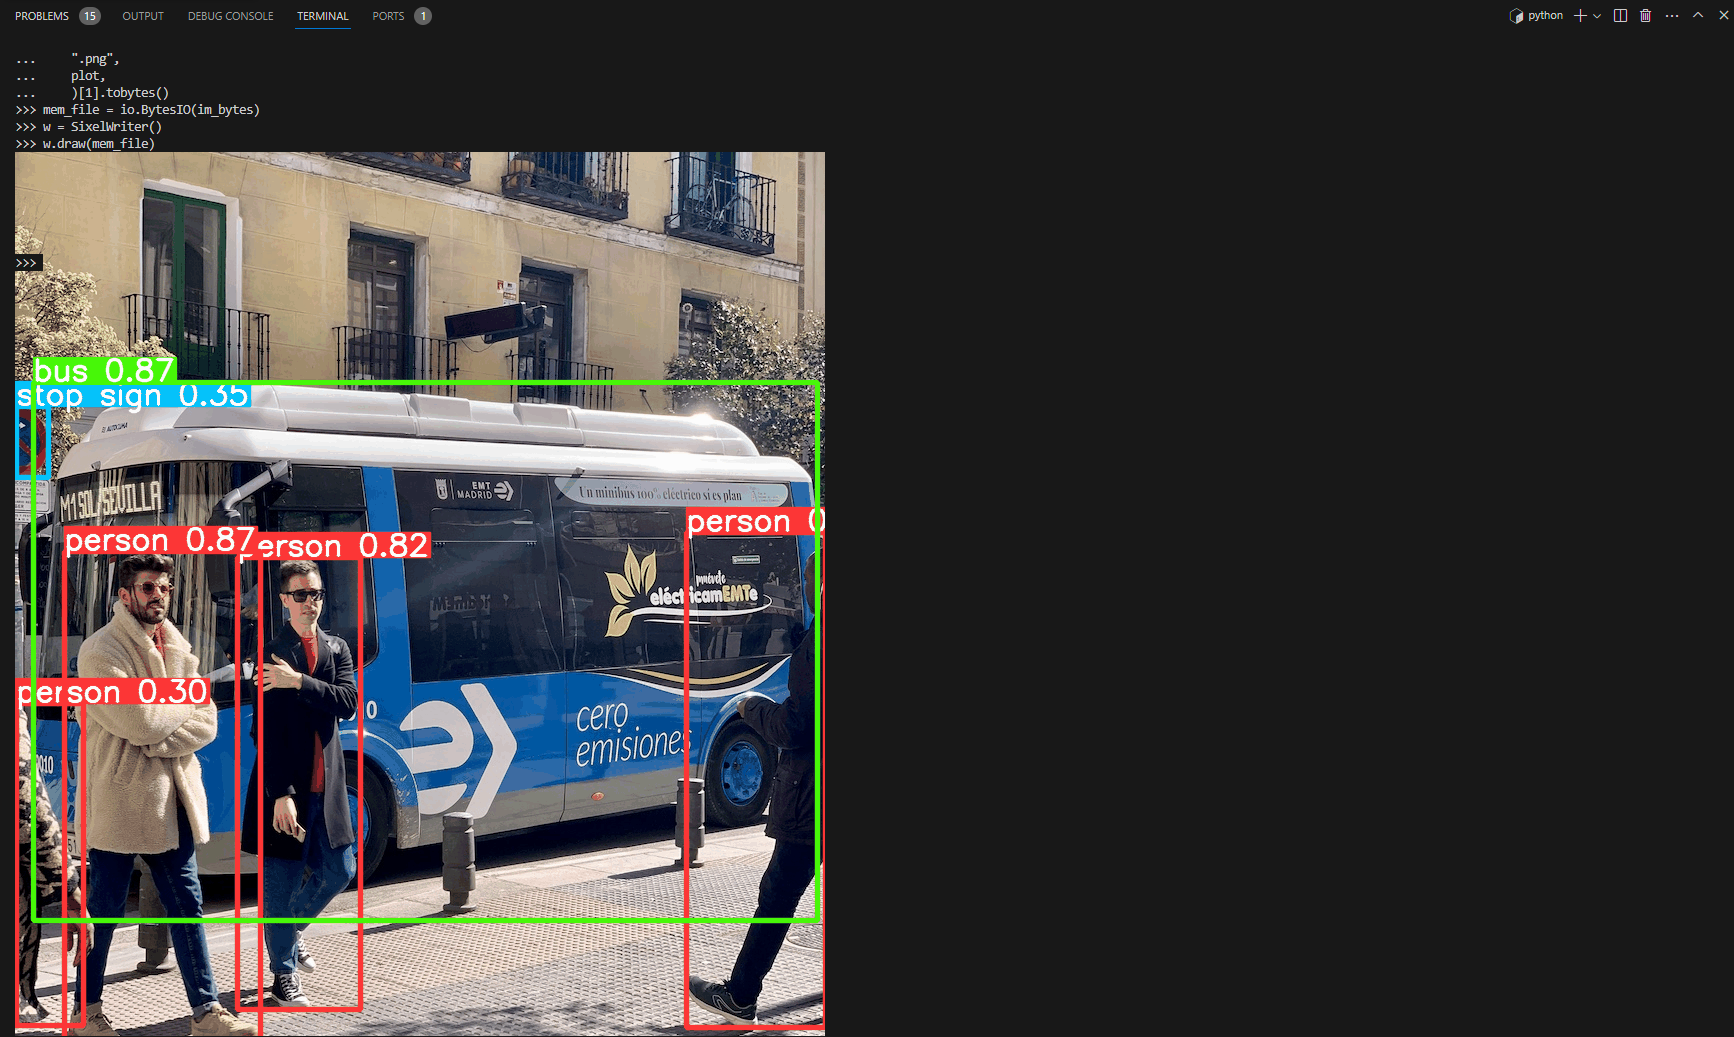
When connecting to a remote machine, normally visualizing image results is not possible or requires moving data to a local device with a GUI. The VSCode integrated terminal allows for directly rendering images. This is a short demonstration on how to use this in conjunction with `ultralytics` with [prediction results](../modes/predict.md).
!!! warning
Only compatible with Linux and MacOS. Check the [VSCode repository](https://github.com/microsoft/vscode), check [Issue status](https://github.com/microsoft/vscode/issues/198622), or [documentation](https://code.visualstudio.com/docs) for updates about Windows support to view images in terminal with `sixel`.
The VSCode compatible protocols for viewing images using the integrated terminal are [`sixel`](https://en.wikipedia.org/wiki/Sixel) and [`iTerm`](https://iterm2.com/documentation-images.html). This guide will demonstrate use of the `sixel` protocol.
## Process
1. First, you must enable settings `terminal.integrated.enableImages` and `terminal.integrated.gpuAcceleration` in VSCode.
```yaml
"terminal.integrated.gpuAcceleration": "auto" # "auto" is default, can also use "on"
"terminal.integrated.enableImages": false
```

2. Install the `python-sixel` library in your virtual environment. This is a [fork](https://github.com/lubosz/python-sixel?tab=readme-ov-file) of the `PySixel` library, which is no longer maintained.
```bash
pip install sixel
```
3. Load a model and execute inference, then plot the results and store in a variable. See more about inference arguments and working with results on the [predict mode](../modes/predict.md) page.
```{ .py .annotate }
from ultralytics import YOLO
# Load a model
model = YOLO("yolov8n.pt")
# Run inference on an image
results = model.predict(source="ultralytics/assets/bus.jpg")
# Plot inference results
plot = results[0].plot() # (1)!
```
1. See [plot method parameters](../modes/predict.md#plot-method-parameters) to see possible arguments to use.
4. Now, use OpenCV to convert the `numpy.ndarray` to `bytes` data. Then use `io.BytesIO` to make a "file-like" object.
```{ .py .annotate }
import io
import cv2
# Results image as bytes
im_bytes = cv2.imencode(
".png", # (1)!
plot,
)[1].tobytes() # (2)!
# Image bytes as a file-like object
mem_file = io.BytesIO(im_bytes)
```
1. It's possible to use other image extensions as well.
2. Only the object at index `1` that is returned is needed.
5. Create a `SixelWriter` instance, and then use the `.draw()` method to draw the image in the terminal.
```python
from sixel import SixelWriter
# Create sixel writer object
w = SixelWriter()
# Draw the sixel image in the terminal
w.draw(mem_file)
```
## Example Inference Results

!!! danger
Using this example with videos or animated GIF frames has **not** been tested. Attempt at your own risk.
## Full Code Example
```{ .py .annotate }
import io
import cv2
from sixel import SixelWriter
from ultralytics import YOLO
# Load a model
model = YOLO("yolov8n.pt")
# Run inference on an image
results = model.predict(source="ultralytics/assets/bus.jpg")
# Plot inference results
plot = results[0].plot() # (3)!
# Results image as bytes
im_bytes = cv2.imencode(
".png", # (1)!
plot,
)[1].tobytes() # (2)!
mem_file = io.BytesIO(im_bytes)
w = SixelWriter()
w.draw(mem_file)
```
1. It's possible to use other image extensions as well.
2. Only the object at index `1` that is returned is needed.
3. See [plot method parameters](../modes/predict.md#plot-method-parameters) to see possible arguments to use.
---
!!! tip
You may need to use `clear` to "erase" the view of the image in the terminal.

